Loudness Meter

Monitor live audio in dBFS or LUFS, or check the loudness and true peak of an audio file. Explore level changes over time and download your measurement data.

Loading Loudness Meter...

Monitor Live Audio. Check Finished Files.

Before you reach for a volume control, find out what your audio is doing. Use one online loudness meter to watch an input as it happens or analyze a recording you have already exported.

Watch your input before you record

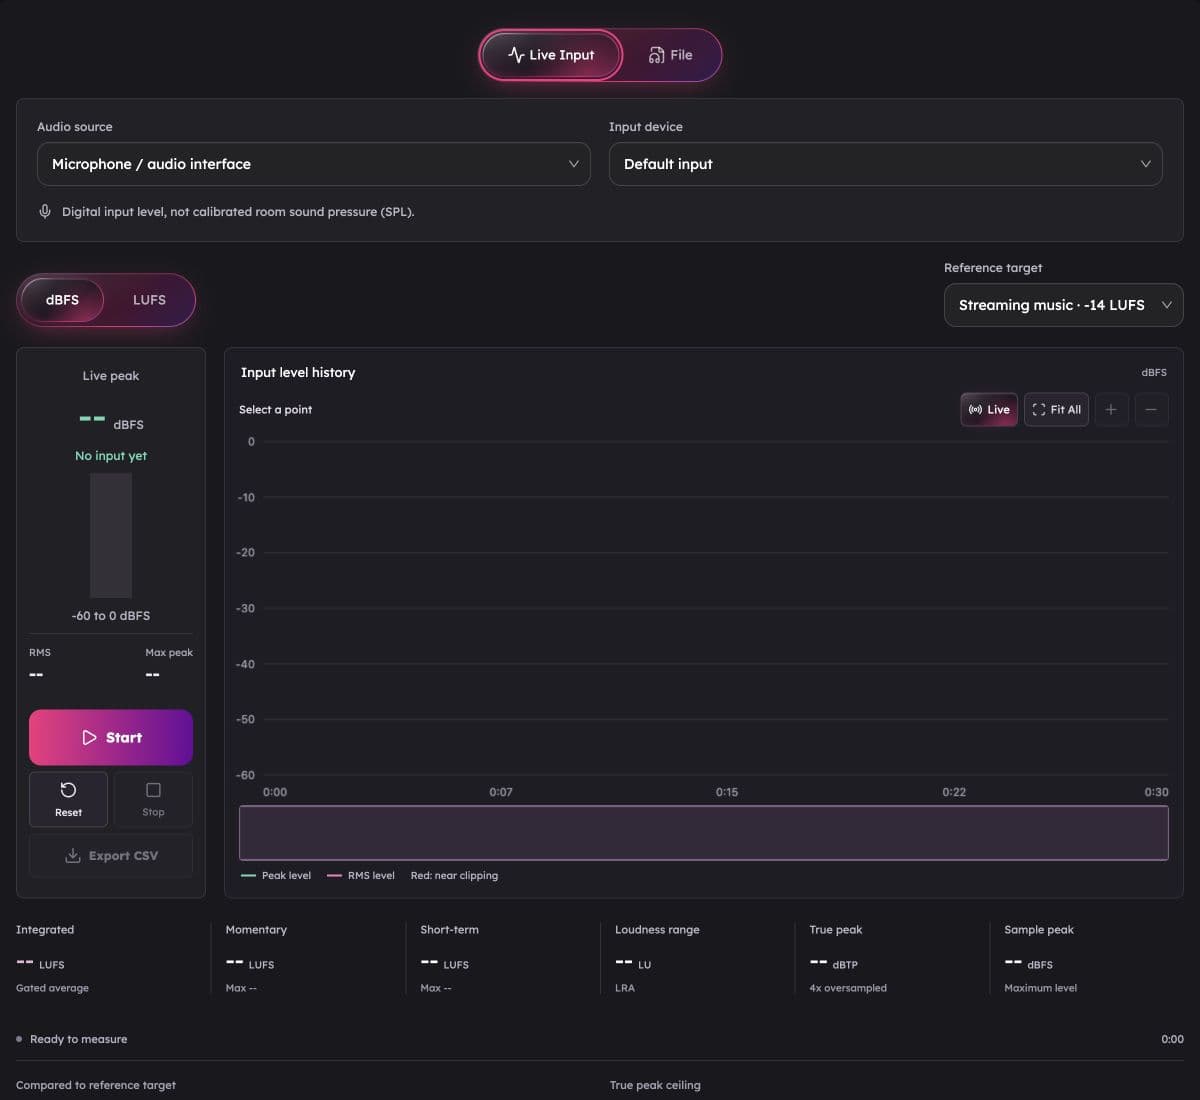
Speak into your microphone or play through an audio interface and follow the incoming signal. Watch peak and RMS levels in dBFS, or switch to LUFS to follow perceived loudness over time.

Color changes make high digital levels easier to spot. Use the readings to decide whether to adjust your device's input gain before the next take. In supported browsers, you can also measure a shared browser tab with audio sharing enabled.

Live readings describe your digital input, not calibrated environmental sound pressure.

AudioMuse live input meter with dBFS and LUFS controls, reference target and a browsable history timeline
Live input view, ready for a new measurement.

Check the file your listeners will hear

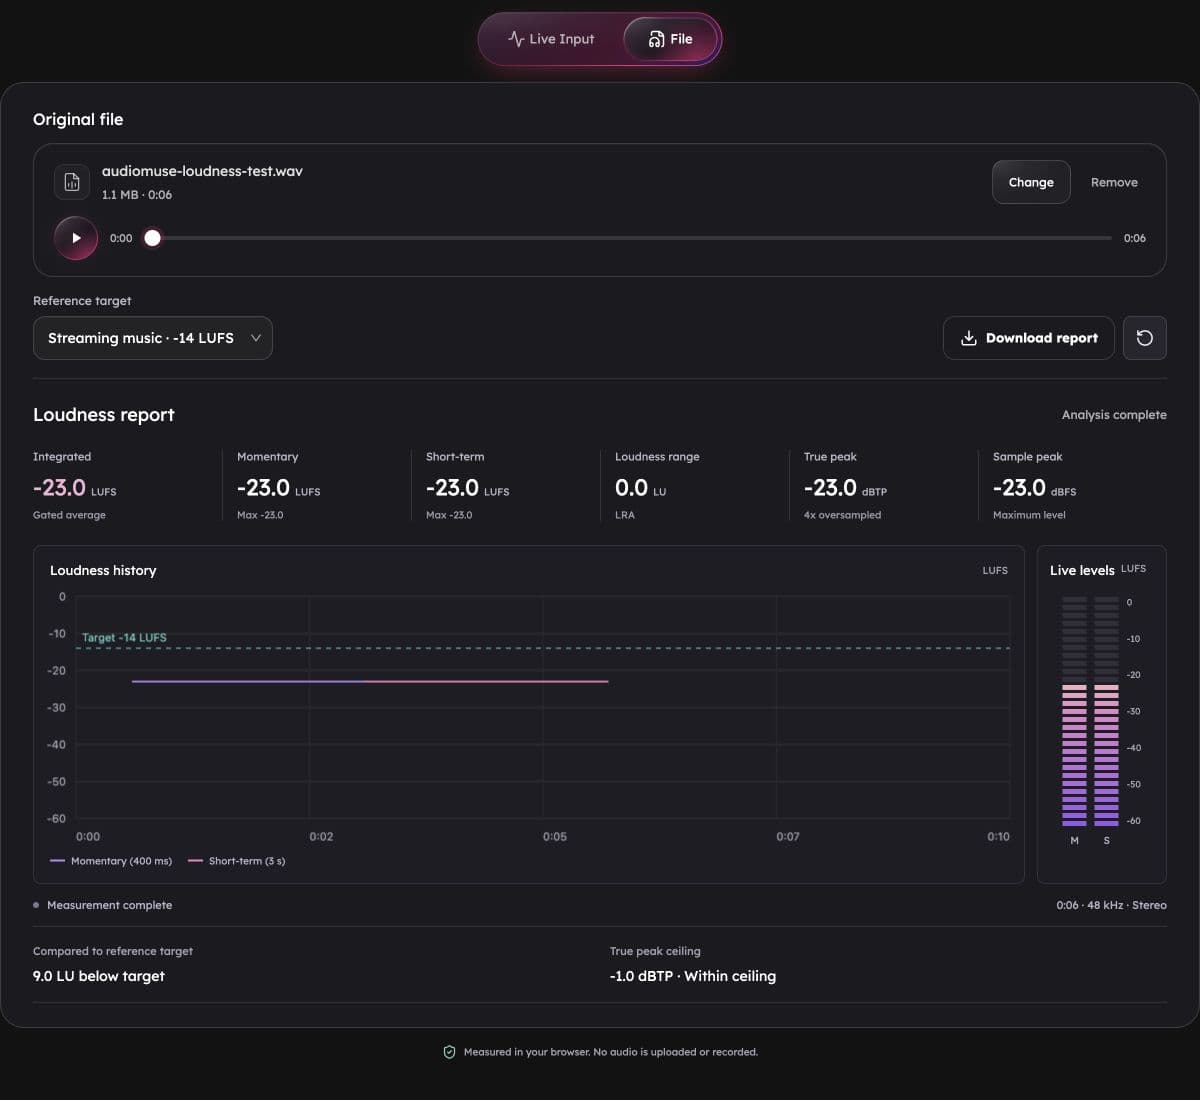
Open a finished mix, podcast episode or voice-over in the file loudness analyzer. Read integrated LUFS, momentary and short-term loudness, true peak, sample peak and loudness range together.

Compare the measured loudness with your selected reference and review the history before making changes elsewhere. This LUFS checker analyzes the file without changing its volume, so you keep the original recording intact.

Supports mono and stereo MP3, WAV, FLAC, M4A, AAC, OGG, Opus and AIFF files. Audio is processed locally in your browser.

AudioMuse file loudness report showing LUFS, true peak, loudness range, history and reference comparison
Example report from a six-second test tone, not a recommended mastering target.

Find the Moment Your Levels Change

A fast-moving number cannot tell the whole story. The live timeline keeps recent measurements in view so you can inspect a sudden peak or a quieter passage after it happens.

Follow the current signal

Keep the view following live input while you speak or play. Peak and RMS traces reveal digital level changes; the LUFS view follows momentary and short-term loudness.

Look back at a specific moment

Zoom into the history, move through the overview and select a point to inspect its time and level. Fit the full session into view when you need the broader picture.

Pause and keep your findings

Pause measurement to review what you have captured, then resume when ready. Export the session data as CSV to keep a record beyond the browser tab.

Check Your Sound Before Recording or Publishing

Set up a voice recording

Not sure whether your microphone input is too high? Check a few quiet and louder phrases before recording a voice-over or going live. Watch the peaks as you adjust your equipment, instead of judging input gain by headphone volume alone.

Review a podcast episode

Does this episode seem quieter than the last one? Measure the complete export and compare integrated loudness and true peak with your delivery reference. Save the report to discuss a level adjustment with your editor before publishing.

Check a mix or master

A track can stay below full scale and still sound very different in loudness from another mix. Check its LUFS, peak headroom and loudness range together before delivery. Use the numbers to inform your next decision, not to replace listening.

Understand Your Loudness Results

Each reading answers a different question. LUFS describes perceived loudness; dBFS and dBTP describe digital levels and peaks. Read them together rather than chasing one number.

Audio loudness measurements and what to look for
MeasurementWhat it tells you
Integrated loudnessLUFSHow loud is the complete recording?

The gated average across the measured audio. Start here when comparing a finished episode or music export with a loudness reference.

Momentary loudnessLUFSWhat is happening right now?

A 400-millisecond view that follows brief changes in speech or music, rather than averaging them across the whole recording.

Short-term loudnessLUFSHow loud is this passage?

A three-second window that makes it easier to follow the level of a phrase or section without focusing on every brief fluctuation.

True peakdBTPHow much peak headroom is left?

An estimate of peaks between digital samples. Check it alongside integrated loudness when reviewing an export before delivery.

Sample peakdBFSHow close do samples get to full scale?

The highest measured digital sample level. Values close to 0 dBFS leave little headroom; negative values are normal for digital audio.

Loudness rangeLUHow much does the loudness vary?

A measure of longer-term loudness variation. Use it to understand contrast between quieter and louder sections, not as a score for sound quality.

What Do Your dBFS Levels Mean?

Wondering whether your microphone is too quiet or too loud? Start with the peaks. 0 dBFS is digital full scale, so -6 dBFS is a higher level than -18 dBFS. Negative numbers are normal, not an error.

Example speech recording peak levels, their meaning and next actions
Speech peak exampleWhat it means and what to do
-30 dBFSA low speech peak

If your louder phrases only reach this level, check microphone distance and input gain. Listen for noise before turning the signal up: gain raises the background noise too. A low reading alone does not mean the recording is poor.

-12 to -6 dBFSRoom for louder moments

A useful starting point for ordinary speech recording peaks, not a delivery requirement. Test your louder phrases and leave room for an unexpected laugh or emphasis.

-3 dBFSLittle room for a sudden peak

Only 3 dB remains before full scale. During recording, consider lowering input gain if your voice may get louder. This reading does not mean the audio is already distorted.

0 dBFSAt digital full scale

There is no upward sample headroom. Check for clipping and reduce input gain before another take. Turning down an already clipped recording does not restore the lost waveform.

These examples describe speech recording peaks, not RMS levels or universal mastering targets. dBFS measures the digital signal, not the sound pressure in your room. It cannot tell you how loud your headphones are or whether a listening level is safe. Read Adobe's explanation of digital levels.

Is Your Audio Too Quiet or Too Loud?

Use integrated LUFS to compare the overall loudness of a finished file with your chosen reference. A less negative value means higher measured loudness. The useful question is how far your result is from the target, not whether the number is negative.

Example: comparing a complete recording with a -16 LUFS target

Integrated loudness examples relative to a minus 16 LUFS reference
Integrated loudnessHow to interpret the result
-20 LUFS4 LU below the reference

The measured overall loudness is lower than the -16 LUFS target. Check true-peak headroom before raising the level.

-16 LUFSMatches the reference

The overall reading matches this target. Still listen for uneven passages and check true peak; matching LUFS is not a sound-quality score.

-12 LUFS4 LU above the reference

The measured overall loudness is higher than this target. Lower the level if your delivery calls for -16 LUFS, rather than pushing it louder.

Choose the reference for your destination. Spotify describes -14 LUFS for its normal playback normalization, while Apple Podcasts recommends approximately -16 LKFS, within 1 dB. LKFS and LUFS are equivalent units for this comparison. These are different playback and delivery contexts, not one compulsory target for every mix.

Quiet Audio, High Peaks: Why Turning It Up May Not Work

A recording can sound quiet overall while a few brief peaks are already near full scale. Loudness and peak level answer different questions, so check both before adding gain.

For example, a file measures -20 LUFS with a true peak of -1 dBTP. Adding 4 dB of gain would bring its loudness roughly toward -16 LUFS, but would also raise the estimated true peak to +3 dBTP, above full scale.

Check the peaks before raising the volume

Review the loud moments first. You may need to reduce isolated peaks, rebalance sections or use suitable compression or limiting before increasing overall gain. Re-measure the final export after making changes.

Use true peak to check estimated peaks between samples, not just the sample peak reading. A louder file is not automatically a better mix, and turning up playback volume does not change the file's measured loudness.

Compare With a Reference. Keep the Results.

Choose a streaming music, stereo podcast, EBU R128 or ATSC A/85 reference, or enter your own LUFS target. See the difference between the measured loudness and that reference, alongside the true-peak comparison.

These presets are comparison points for different workflows, not a universal mastering rule or a guarantee that a platform will approve your audio. Use the delivery requirements for your project when choosing a target.

A report you can take with you

Download a CSV report after file analysis or export captured data from a live session. Keep measurement records with your project, compare separate exports or share the numbers with a collaborator.

Your audio stays on your device during analysis. Live metering measures the incoming signal without saving an audio recording; the export contains measurement data.

Need to Adjust the Loudness?

Use the meter to understand the recording first. When the file needs a different overall level, continue with Audio Normalizer to adjust the audio and export a new file.

Open Audio Normalizer